 Up
Up
|
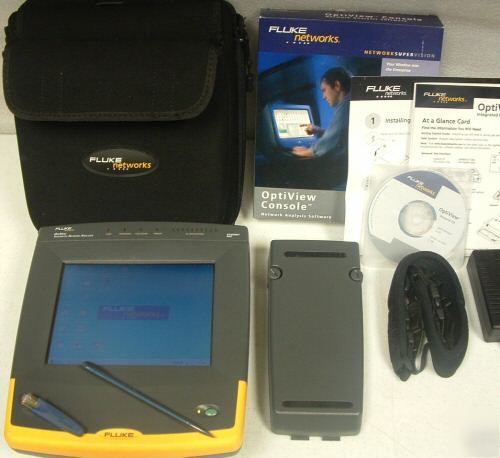
Fluke OPTIVIEW PRO, OPV-PRO Network Analyzer. Includes Optiview Console! Be sure to add us to your Favorites list! Warranty: 30 Day Exchange Warranty Fluke OptiView Intergrated Network Analyzer PRO, OPV-PRO With Optiview Console! THIS OPTIVIEW RETAILED FOR AROUND $23,000 NEW Features: Complete network vision in seconds Combines seven layer protocol analysis, active discovery, SNMP device analysis, RMON2 traffic analysis and physical layer testing into a mobile solution Design and user interface equally effective whether the unit is carried as a portable device or placed semi-permanently on a network link Web enabled remote analysis allows up to seven users to access a single unit simultaneously. The Analyzer is designed for troubleshooting and monitoring Local Area Networks (LANs). The analyzer tests all seven OSI layers. It tests from the cable to the application layer and everything in between, so problems have nowhere to hide. What could be more powerful than all of your network test tools put together? Meet the OptiView Integrated Network Analyzer. It combines all the network monitoring and troubleshooting capabilities you need in one power-packed handheld tool. Including a high-performance protocol analyzer. A fast cable tester. RMON2 probe. Making this the only portable test tool you need. And OptiView's "whole" is smarter and easier to use than the sum of its parts-giving you new levels of facility, functionality and feature richness that an armful of standalone tools can't deliver. With the OptiView analyzer, it's simply faster and easier to get a comprehensive view of your network and isolate any problems. * Complete network vision in seconds * Combines seven layer protocol analysis, active discovery, SNMP device analysis, RMON2 traffic analysis and physical layer testing into a mobile solution * Design and user interface equally effective whether the unit is carried as a portable device or placed semi-permanently on a network link * Web enabled remote analysis allows up to seven users to access a single unit simultaneously * Direct connection to 100BASE-FX (Pro Models) * Packet capture and decode (Pro Model) * RMON II traffic analysis (Pro Model) * Gigabit testing capabilities (Pro Gigabit Model) * Cable testing includes both Copper cat5, cat5e, cat6 & Fiber Optic (optional fiber adapters not included) Fiber Testing includes MultiMode, Single Mode. (We do carry fiber adapters for this unit if interested email us for quote) * Active discovery in switched networks * Fully automatic IP configuration-even without DHCP Optiview Twisted-Pair Detail Screen Now one tool is all it takes to analyze your entire network. The OptiView analyzer combines a high-performance protocol analyzer and cable tester together with the advanced features to keep you on top of your network. In a single handheld unit, OptiView integrates: * Active discovery in switched networks * Fully automatic IP configuration-even without DHCP * Direct connection to 100BASE-FX (Pro Models) * Packet capture and decode (Pro Model) * RMON II traffic analysis (Pro Model) * Gigabit testing capabilities (Pro Gigabit Model) As soon as it's connected to the network, the Optiview analyzer starts its discovery process. This process included real time results of devices, networks and problems. The OptiView analyzer screen will display your network as network type. Networks and all associated devices are discovered by traffic monitoring and actively querying the hosts. The OptiView analyzer Problem Discovery Screen displays all network hosts that may be experiencing problems. Problems are reported according to severity - error, warning or informational. Resolved problems are also displayed. The Overview Screen displays critical information about a selected device. The device detail can include: * Remote monitoring capabilities When connected to a copper media network, the OptiView analyzer will automatically perform a cable test and provide you with the cable length to the attached device even into a live switch or hub port. Select the Twisted-Pair Detail Screen and see: * Anomalies (shorts, opens and split pairs) Packet Capture, Filter and Decode Even at gigabit speeds, the OptiView analyzer is capable of full line-rate packet capture and decode. For more selective packet captures, use the context sensitive filter and the packet capture engine is automatically populated with the source and/or source and destination addresses of your selection. As you have come to expect from a traditional protocol analyzer, the OptiView analyzers'allows you to set the capture buffer size, slice size, buffer configuration and various other parameters. This unit is Part of the Fluke Family which conceits of some of the highest quality Testing Equipment in the industry. For instance in Copper and Fiber Testing, Fluke has the DSP-4000, DSP-4100, DSP-4300, DTX-1200 & DTX-1800 Cable Analyzers. In Networking Fluke has the Fluke OneTouch and NetTest EtherScope Network Assistant Analyzer and so many more. That's why we come to trust Fluke for the right tester for the right Job. (This Unit has been Refurbished by Fluke, we were told it has not been used and was just a Fluke Demo) Packed from Fluke in a Fluke BOX! Fluke OptiView Console OCV Network Analysis Software Version 6.0 THE OPTIVIEW CONSOLE HAS NEVER BEEN USED AND RETAILS AROUND $12,500 Provides comprehensive views of enterprise activity, provides errors and alarms for devices across an entire network. * Centralized analysis of your Enterprise network * Distributed LAN and WAN visibility using your OptiView analyzers * Automatic documentation, diagramming, problem identification and notification * Long-term trending and capacity planning * Scheduled, web-accessible reports and network maps * Integration with other Network Management solutions Our OptiView Network Analysis Solution is a breakthrough in integrated portable and distributed monitoring and analysis hardware and software. It gives you a fast, complete view of your entire enterprise, from portable devices to workgroup analyzers to highperformance gigabit line-rate link analyzers – across multiple vendors. Only OptiView combines the analysis techniques of packet capture, statistical analysis and network discovery to deliver new speed. New ease of use. New depth of vision. New control to optimize the performance of WAN, LAN and wireless networks. Distributed Vision, Centralized Analysis. OptiView Console works with OptiView Integrated Network Analyzers, Workgroup Analyzers, and WAN Analyzers to give you visibility into your Enterprise network from one central location. Using a variety of data sources, OptiView Console provides detailed device discovery data, problem identification, and interface monitoring. This information is used to provide automated reporting, diagramming, trending, and event notification. This license provides unrestricted software agent deployment, with one viewer, and up to 2, 000 nodes monitored with software agents. OptiView Console works seamlessly with our award-winning, network test and analysis solutions. You can increase the power of your OptiView Console application by combining it with our powerful test tools such as the OptiView Integrated Analyzer, the OptiView Workgroup Analyzer or the OptiView WAN Analyzer. OptiView Console can automatically discover any connected OptiView analyzer up to ten hops away. OptiView analyzers can serve as remote data sources, extending OptiView Console's power to encompass the entire enterprise network. Generating maps and reports for your remote sites is simple. Invoking the remote user interface gives you powerful live troubleshooting capabilities, including remote packet capture. OptiView Console and OptiView analyzers constantly monitor the status of key network devices. If an OptiView LAN or WAN analyzer detects a network problem or a change in key device status, OptiView Console will immediately know and can notify you by page or e-mail. OptiView Console protects your investment in other network tools by discovering Sniffers and CiscoWorks servers. You can launch SniffView and CiscoWorks from the OptiView Console user interface. You can also trend your Sniffer interfaces. Utilizing your RMON-enabled devices as another data source, OptiView Console can provide an extensive array of RMON reports. OptiView Console complements and adds value to your existing network management systems by integrating with solutions such as Concord eHealth and HP OpenView Network Node Manager. WAN conversation data collected by OptiView Console from OptiView WAN analyzers can be exported for use in OPNET Technologies’ IT GURU. OptiView Console quickly and automatically discovers active devices, giving you the most accurate view into what's on your network. Discovered devices are automatically classified and placed into categories such as Key Devices, Servers, Routers, Switches, Printers, SNMP Agents, RMON Devices, Utilization Sources, and Fluke Networks Tools. * Device Names: DNS, SNMP, IPX Login and NetBIOS Machine Names * Device Addresses: IP Addresses and Subnet Masks, IPX, and MAC Addresses * Device Services: Switching, Routing, Email, Web, and Print services * Interfaces: Type, Speed, State, MTU, slot and port, VLAN ID, VC descriptions * Protocols: IP, IPX, and NetBIOS protocol and configuration information * Put an end to guessing where devices are connected. OptiView Console continuously monitors the port status of switches and notes the devices directly connected to each port. Interface traffic statistics can be tracked up to one year. Alarm thresholds for each interface can be set to trigger a page or email notification if trouble arises. OptiView Console can be easily set up to generate a page, email or SNMP trap on network errors and user configurable threshold violations. Whether you need inventory reports with device details or you need to quickly create an accurate map of your network, OptiView Console offers fast, automatic documentation to meet your needs. OptiView Console automates manual, time-consuming tasks such as asset discovery, management and reporting, link usage analysis and capacity planning reporting, and network diagramming. Top senders and receivers are quickly identified. Look at utilization trends for your top interfaces. * IP, IPX, and NetBIOS Inventories * Trended Utilization Sources * Top Interfaces by Utilization, Collision, Error, or Broadcast Rate * Top Applications, Conversations, Hosts, and Protocols * Frame Relay, ATM, PPP/HDLC Link Usage * Frame Relay and ATM Virtual Circuit Utilization * Errors, Alarms, and Problem Logs * Capacity Planning reports for ATM, PoS, Frame Relay, and PPP/HDLC Are you spending hours manually creating diagrams of your network? Now you can get the network drawings you need, anytime. Using OptiView analyzers with the VLAN Vision option as data sources, OptiView Console can create VLAN maps with user-selectable device categories. Using OptiView WAN analyzers as data sources, OptiView Console can generate WAN Link Virtual Circuit maps. Select the map you’d like to generate and the appropriate OptiView Console data is exported to Microsoft Visio. A diagram will build automatically as you watch. Remote monitoring and remote access to data OptiView Console works with OptiView Integrated Network Analyzers, Workgroup Analyzers, and WAN Analyzers to give you visibility into your Enterprise network from one central location. These OptiView LAN and WAN “hardware agents, together with OptiView Console’s software agents, automatically perform detailed device discovery, problem identification, and interface monitoring. This information in turn is automatically imported into OptiView Console for reporting, diagramming, trending, capacity planning, and event notification. This fast, easy, and accurate documentation can be generated on-demand or at a user-defined, scheduled interval. Archived reports and maps can be viewed remotely using OptiView Console’s built-in Web Reporter. Utilize the capabilities of your RMON-enabled devices with OptiView Console’s RMON Inspector application and get an extensive array of RMON reports. Click on an RMON device and select from a variety of views including: Utilization, Errors, Top Users and Top User Matrix, Top Applications, Network and Application Layer Hosts, Network and Application Layer Matrix, and Ethernet History. See the types of errors ocurring on the network segment. See packet rates and their impact on network utilization. See up to 40 nodes and up to 780 conversations between those nodes that are consuming the most bandwidth. See long-term historical views of network statistics. Longterm trending and reporting Whether you're keeping an eye on your service provider or watching key links to plan for future growth, OptiView Console provides the long-term views you need to make important decisions regarding network capacity. OptiView Console offers summary reports that provide one-page, at-a-glance views of link utilization for the last month, 3 months, 6 months, or 1 year. Detailed reports are also available, providing a more granular look at trended utilization for a user-defined time period. WAN capacity planning reports show key statistics such as link utilization, throughput, good packet rate, and cell rate broken down by DTE and DCE. * (1) Fluke Optiview PRO OPV-PRO * (1) Fluke Optiview Console V6.0 * (1) Optiview Resource CD * (1) Getting Started Guide |